Introduction
At work, one of the things we do is ballpark the fiscal effects of income tax policy changes. A lot of these tasks rhyme, and instead of whipping up Excel sheets or Python scripts a la carte, it pays to set up some infrastructure. Primarily two things: a way to quickly query income tax data, and a way to run simulations with changeable parameters. Keep in mind there are many ways to skin a cat. This is my approach so far.
Data Ingest
Unlike government organizations and some academic institutions, we do not have IRS microdata to work with. They sell it but unfortunately the latest data is from tax year 2015. So we use the next best thing: IRS Statistics of Income (SOI) tables. These provide aggregates grouped by dimensions like AGI bracket, filing status, state, tax line items, and more. This is what they look like:
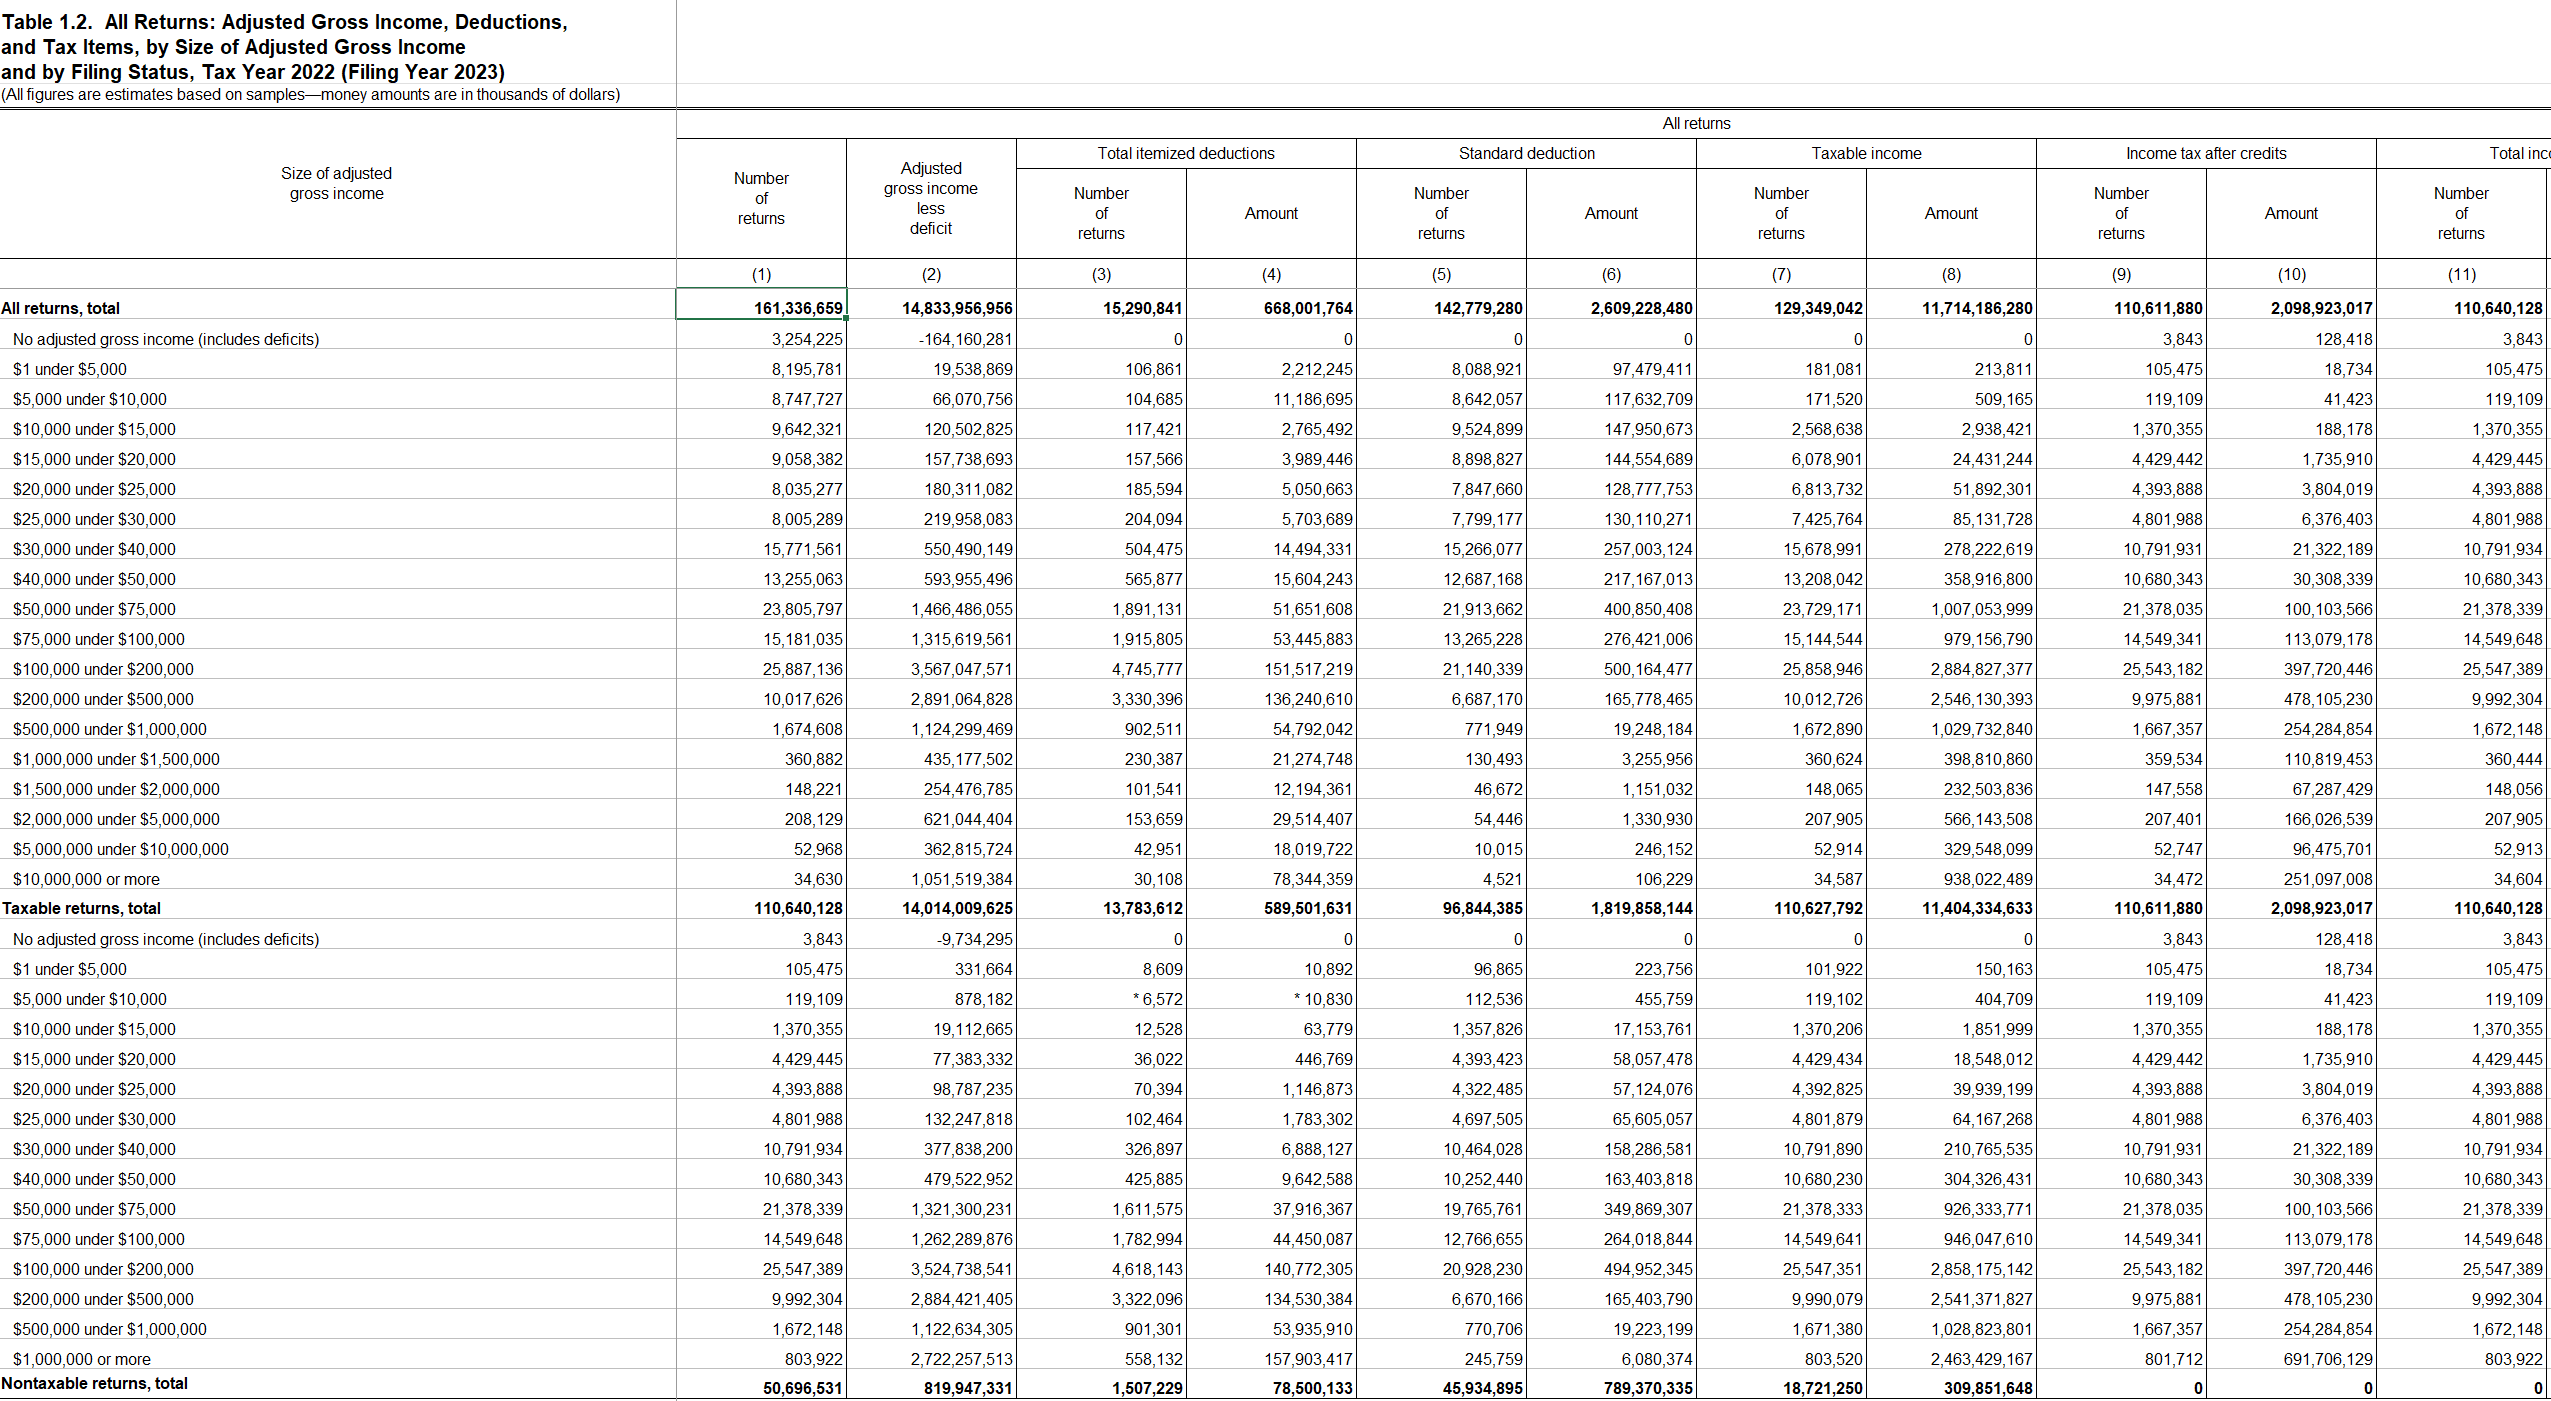
One table per tax year per dimensional split. For instance, this table is tax year 2022 tax items grouped by AGI bracket and filing status. There's another table for 2022 tax items by AGI bracket and state, and another for itemized deductions grouped by just filing status, etc.
Okay, how do we tackle this? Remember we want to be able to query these tables, slice / transform / process however we want, and then feed them into a simulation.
- This data is perfect for a good old relational database. Tabular with clearly defined dimensions that I'll be using as join keys. Small amount of data (maybe in the low GB's total just as a guess).
- There is one (.xls because it's 1997) file for each table for each year, and there is no "download all" button. I will want to write a script to download every year of each table, add a "year" column, and concatenate them into a single table.
- These tables are not in a uniform format. To get them from source format to target format we will need to do some parsing and transformation. (Most of the time AI tools are awesome at this---just upload the source data and tell it the output format you want---but these tables are so ugly I had to get more hands-on than I wanted to.)
- There's no great way to name these tables concisely, so I decide to stick with the IRS table numbers (e.g. Table 3.2, Table 1.4A) and include a glossary file. Think a JSON or YML file with descriptors for each table.
This wrangling of non-uniform table formats is the most tedious and by far the most time consuming step. A friend of mine once signed up for a data science bootcamp and immediately withdrew when he realized that cleaning / wrangling was 80 percent of the work. In the words of Ronnie Coleman, "Everybody wanna be a bodybuilder, but don't nobody wanna lift this heavy ass weight! But I'll do it though!!!"
These datasets are released once per year, so there's no need for any streaming or automation or anything fancy. Just outline your data model, create the database, and run the ingest script.
Tax Return Object
The most popular Python library for working with data is Pandas. The main object Pandas defines is a DataFrame---basically a table---with tons of methods for grouping, sorting, merging, etc. Pandas is great for most simple analyses. And like it or not, when you are doing a project that you plan on sharing with others who may not have your coding skills, it is important to make your work as simple and accessible as possible. There is usually no need complicate things by starting from scratch or using lesser known libraries.
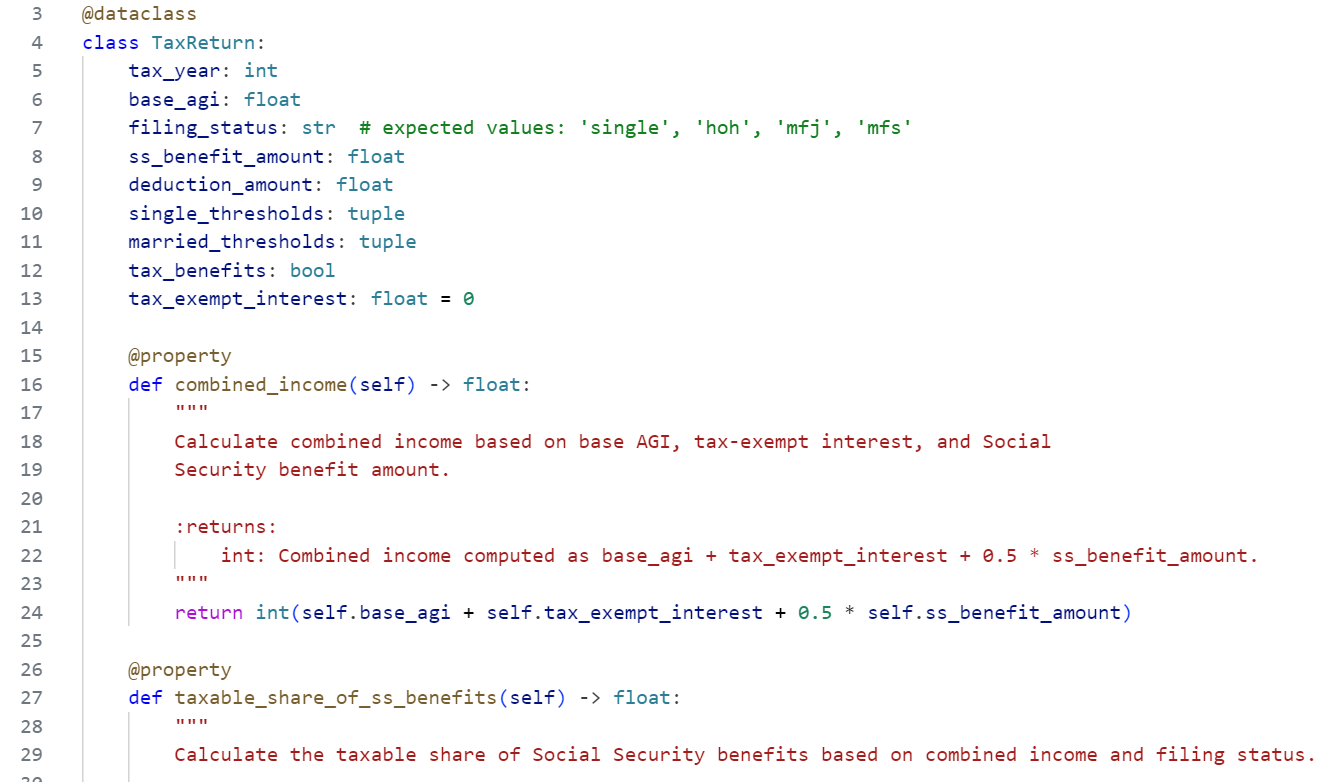
However, Byzantine tax computations offer a perfect excuse to define a TaxReturn class. The detailed rules and conditional logic would make the Pandas code a nightmare to understand much less update. Instead of pulling from DataFrames with marginal rates, deductions, and credits, and defining a mess of custom functions to perform calculations on those DataFrame columns, all of that can be handled by TaxReturn attributes and methods on an individual basis.
So what should our TaxReturn class look like? Python dataclasses are pretty much like regular classes but cleaner, with minimal boilerplate code.
- Attributes store the variables that hold the object's state. AGI, filing status, and tax year are things you'd want to define as attributes.
- Properties provide computed values based on attributes. Unlike methods, they are computed when the object is instantiated. Combined income and taxable income are examples of properties.
- Methods are functions specific to the our class. They can modify the object's state or just perform some logic that depends on one or more of the object's attributes or properties. The main method my TaxReturn class has is compute_income_tax_amount(self, rate_schedule). It could be a property, but (1) it fetches the tax rate schedule from elsewhere and (2) it is a relatively expensive computation; I don't want it to happen every time I create a TaxReturn.
Simulation
Now with our powerful TaxReturn class we can look at all kinds of tax policy changes. Let's say we want to look at raising the top marginal tax rate to 50%. The basic flow is:
- Make two dictionaries, one holding the original tax rate schedule and one holding a copy but with the top marginal rate at 50%.
- Make an empty list or dictionary to store results.
- Use the IRS SOI tables to determine what the tax return attributes should look like. How many are in each AGI bracket? What is the distribution? How many are married filing jointly? Etc. There were 144 million tax returns filed in tax year 2023.
- Instantiate the tax returns in a for loop.
- In a second loop, perform the necessary computations (for example compute_income_tax_amount) for each tax rate schedule and store the results.
- Compare results
The rate schedule is stored outside the TaxReturn class; it's its own thing. But it's not hard to look at policy changes that alter stuff inside the class either. Combined income is coded as a property and is calculated as (AGI + Tax-exempt interest + 1/2 * Social Security benefit amount). What if we want to see how changing that to 80% of the benefit amount would affect revenue? We simply change the property combined_income(self) to a method compute_combined_income(self, benefit_share), paramaterizing the variable we want to change.